
Client name and identifying details have been altered to respect confidentiality. The engineering constraints and outcomes described are representative of work we undertake for organisations in this sector.
A manufacturer had sensors on the floor but no way to turn the data into decisions. Production losses were invisible until monthly reporting — far too late to act.
Machine data was collected but stranded in silos: some in a historian, some in spreadsheets, some only on local panels. Calculating Overall Equipment Effectiveness — availability, performance and quality — was a monthly exercise that told managers what they'd already lost. When a line underperformed, no one could see whether it was downtime, slow cycles or rejects, and improvement effort was aimed blindly.
We built an ingestion layer that normalises data from PLCs, historians and manual logs into a single time-series store, then computes OEE continuously against configurable shift and product definitions. A live dashboard shows line-by-line performance, flags losses as they happen, and lets supervisors drill from a red metric to the underlying events.
Crucially, we separated the real-time view from historical analytics and gave the floor team the former on screens at the line, while managers use the latter for trends. The system was designed to tolerate messy industrial data — gaps, restarts and retrofits — without breaking the numbers.
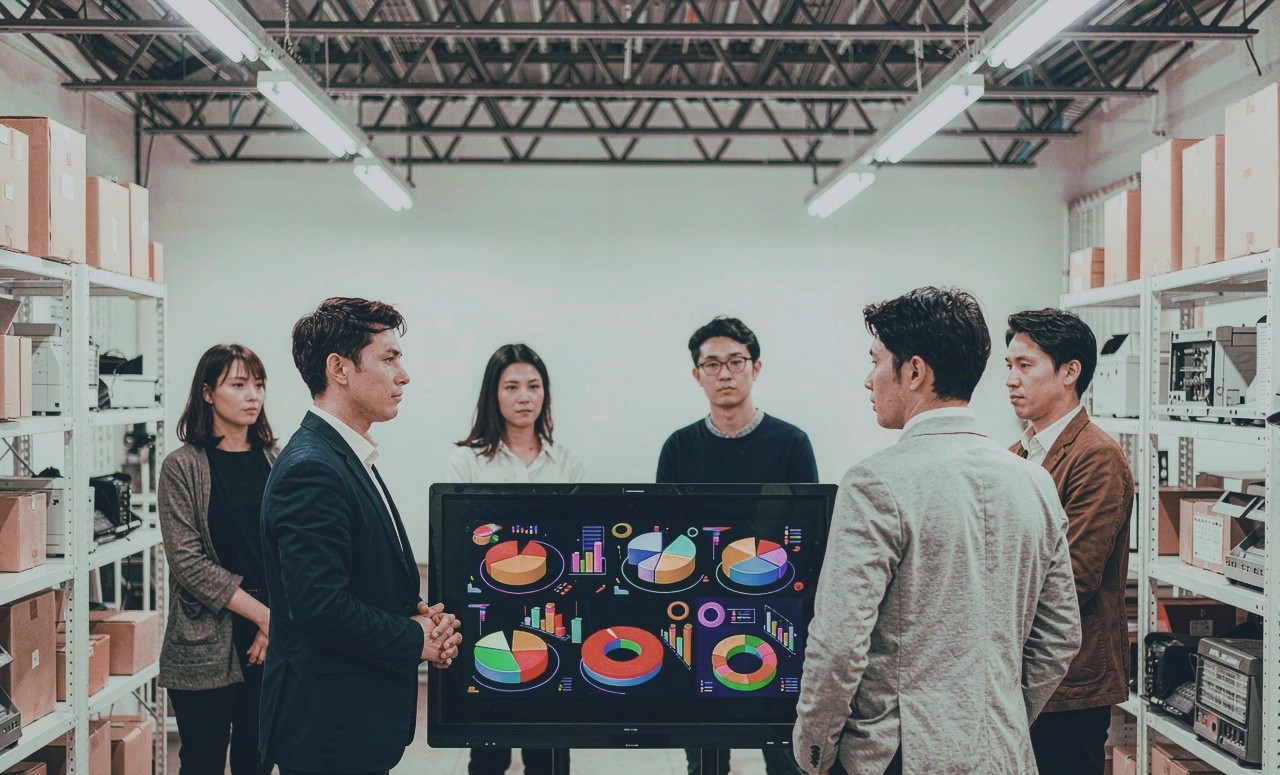
Supervisors now see losses as they occur and target the right cause — downtime, speed or quality — instead of guessing after month-end. The single source of floor truth ended the spreadsheet disputes between shifts, and continuous OEE gave the site a clear, shared improvement target.
Industrial IoT fails more on data quality than on sensors. Half our effort was making messy, intermittent machine data trustworthy enough to base decisions on. Get the ingestion and validation right, and the dashboards almost build themselves.
A snapshot of how this work was delivered, for manufacturers weighing an IoT and performance-visibility investment.
Twenty-two weeks across sensor integration, pipeline build and a shop-floor rollout validated against live production.
A lead engineer, two IoT engineers, one data engineer and plant supervisors who defined what "good" looked like per line.
Edge collection feeding a time-series store, with OEE computed consistently and surfaced on floor displays and management views.
Real-time OEE and bottleneck visibility, turning sensor noise into decisions supervisors could act on within a shift.
The mistake most IoT programmes make is buying sensors before deciding what question they answer. We started with the downtime and bottleneck problems the plant actually cared about, then instrumented only what was needed to answer them — which kept the project affordable and the dashboards uncluttered. Equally important was putting the view on the floor, not just in a manager's report, because visibility that reaches the people running the line is what changes behaviour. Measure OEE the same way everywhere, or the numbers will be argued instead of acted on.